


Software: Python

This project was completed under the mentorship of Dr. Alicia Sasser Modestino, Associate Professor in the School of Public Policy & Urban Affairs and Department of Economics and Executive Director of Community to Community: Policy Equity for All research lab. I worked on the project in collaboration with Dr. Modestino for the duration of the 2024-2025 school year and received a total of $3,450 in funding through the Office of Undergraduate Research and Fellowships PEAK awards ($750 for Base Camp Award, $1,500 for Ascent Award) and the Department of Economics Radivonyk Fund ($1,200).
Dr. Modestino has been working in collaboration with the City of Boston’s Office of Youth Employment and Opportunity (OYEO) for the past few years, specifically in advocating for the value of the Summer Youth Employment Program in marginalized communities. For more on her research and the context of this work, review the SYEP report and policy brief.

The goal of this project was to construct an innovative easy-to-use dashboard to enable users to interactively explore the post-survey data from Boston’s Summer Youth Employment Program from summer 2024 participants. I aim to demonstrate how interactive visualization can enable users to discover interesting insights from the data.
Specific goals:
Implement dashboard in Holoviz Panel (Panel supports most visualization libraries including matplotlib, plotly, etc.)
Demonstrate a variety of different Holoviz Panel widgets
Manage access to data via a well-designed API that mediates data passing between the backend data and frontend user interface

The data for the dashboard is sourced from a master .csv file, titled SYEP.csv in the ‘Datasets’ folder. This master .csv file is simply the aggregation of each individual .csv file in the ‘csv’ subfolder, each of which contains SYEP participant data by program. The ‘xlsx’ subfolder contains all the same data in Excel format. The data includes participants’ answers to survey questions regarding their summer job experience, job search skills, work habits, communication skills, relationships, well-being, and demographics, taken after they completed the Summer Youth Employment Program. All data is from summer 2024 participants.
For privacy purposes, the individual names of students as well as their specific program have been removed from the final dashboard site. Instead, the programs have been categorized by job sector: Hospitality, Childcare, Healthcare, and Finance. Note that some programs under SYEP fall under multiple categories and are reflected as such in the dashboard.

SYEP.xlsx data sample

To create the dashboard, I created two files: syep_api.py and syep_explorer.py.
syep_api.py: The primary API for interacting with the SYEP dataset
Within this file, I created an SYEP_API class, which included functions like:
load_syep – Load in dataset as pandas dataframe
prepare_data – Remove extra whitespace from all data values
filter_data – Filter data by demographics and program attributes and return filtered dataset
create_plot – Create and return a plot (countplot, stacked bar plot, or heatmap) based on plot_type and parameter widget selections
The syep_api.py file also had a main() function to test class functions.
syep_explorer.py: The main application for creating interactive dashboard for SYEP dataset
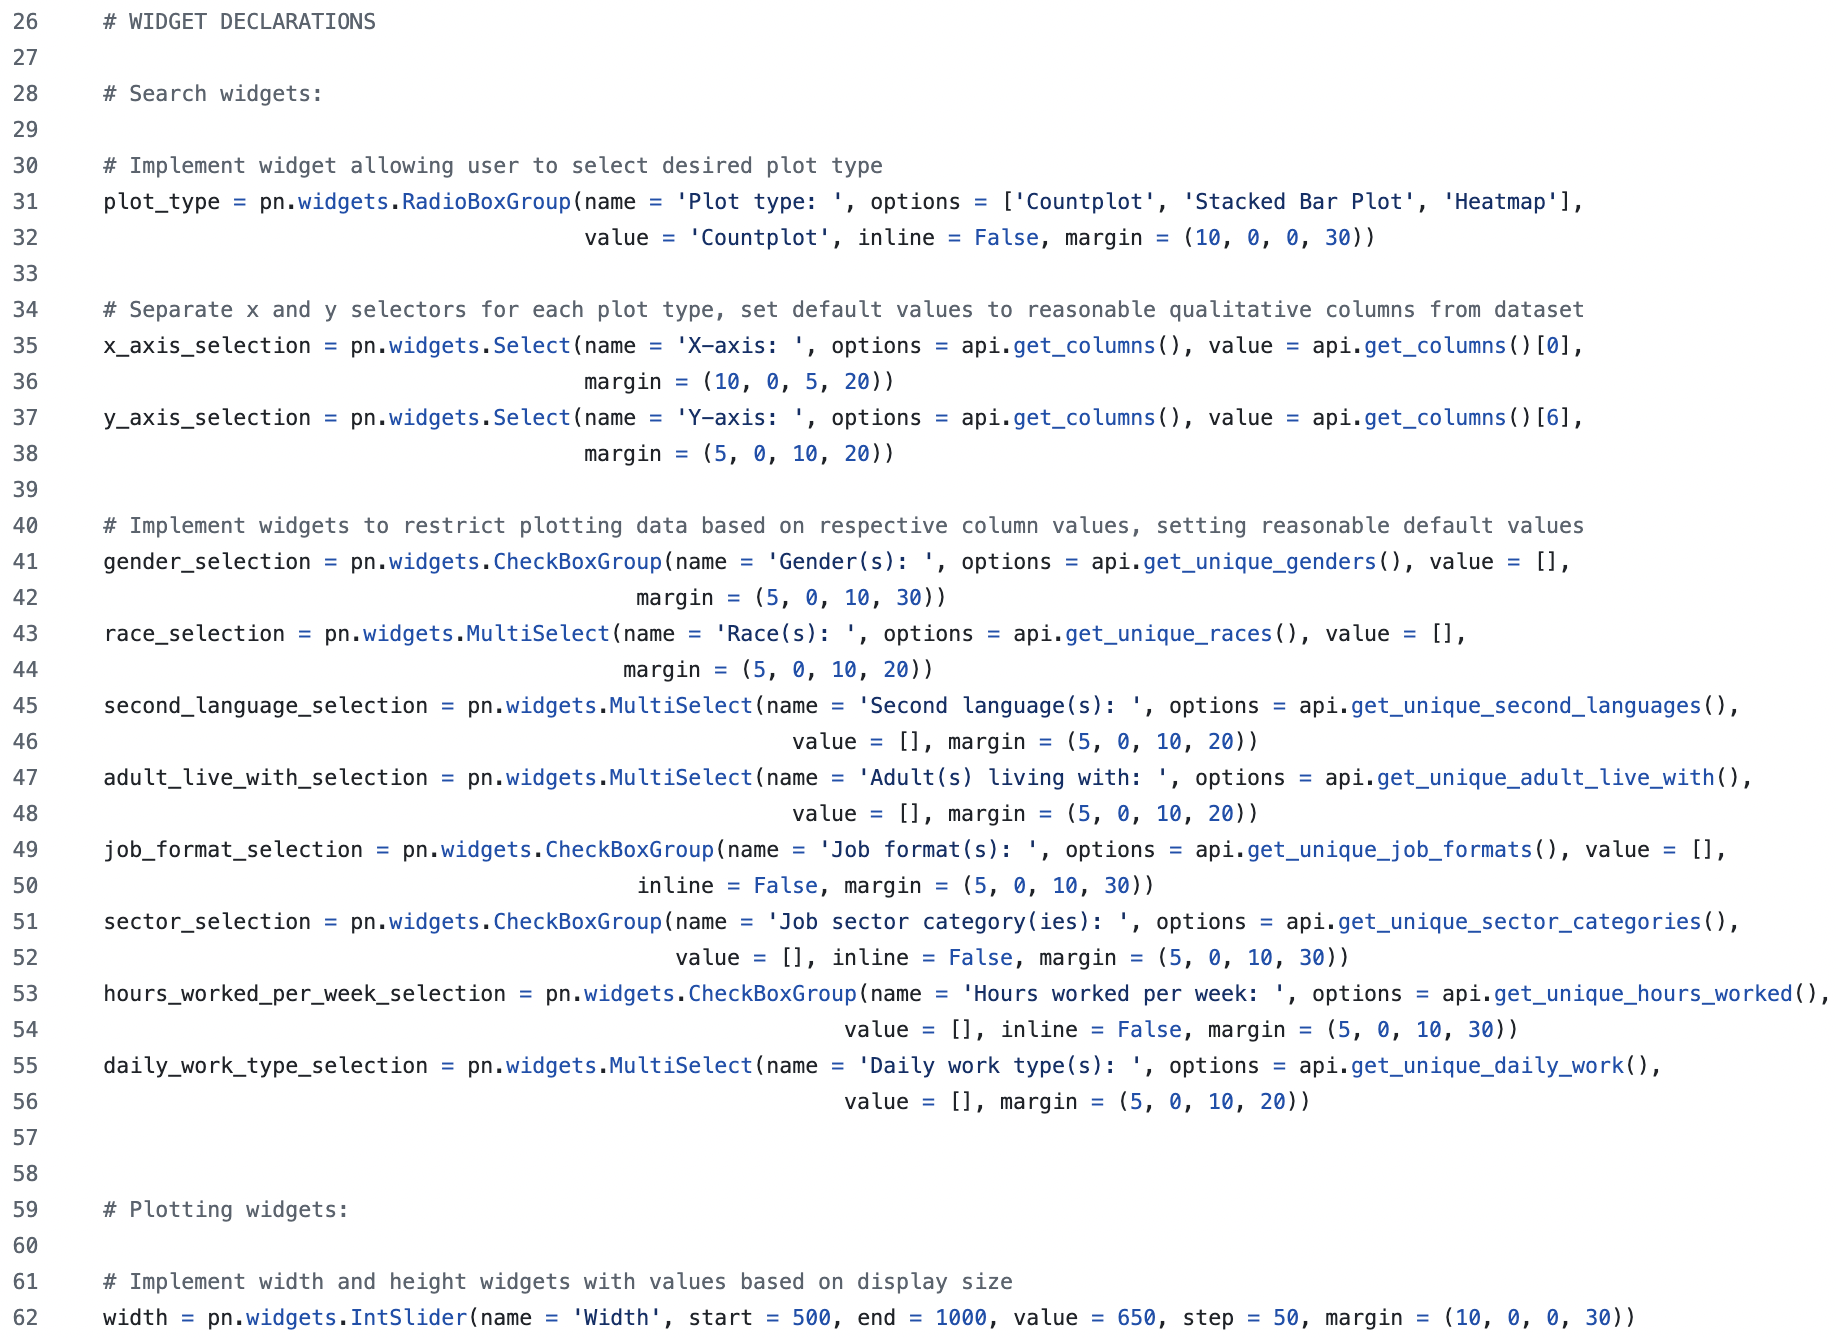
This file included functions to initialize the Holoviz Panel, declare widgets for the dashboard (search widgets, plotting widgets, table widgets), define callback functions to update the dashboard figures based on user selections, create callback bindings that connect widgets to callback functions, define landing page content to be displayed via dialog, define dashboard widget containers (“cards”), and set up the layout of the final dashboard using Holoviz templates and a bit of CSS. Dashboard branding is based off of the City of Boston’s branding guidelines for consistency.
The repository also includes a file titled requirements.txt, which contains all the packages needed to run the program, and a file titled start.sh for the dashboard to be publicly hosted and deployed using Render.
syep_explorer.py code sample


Dashboard landing page

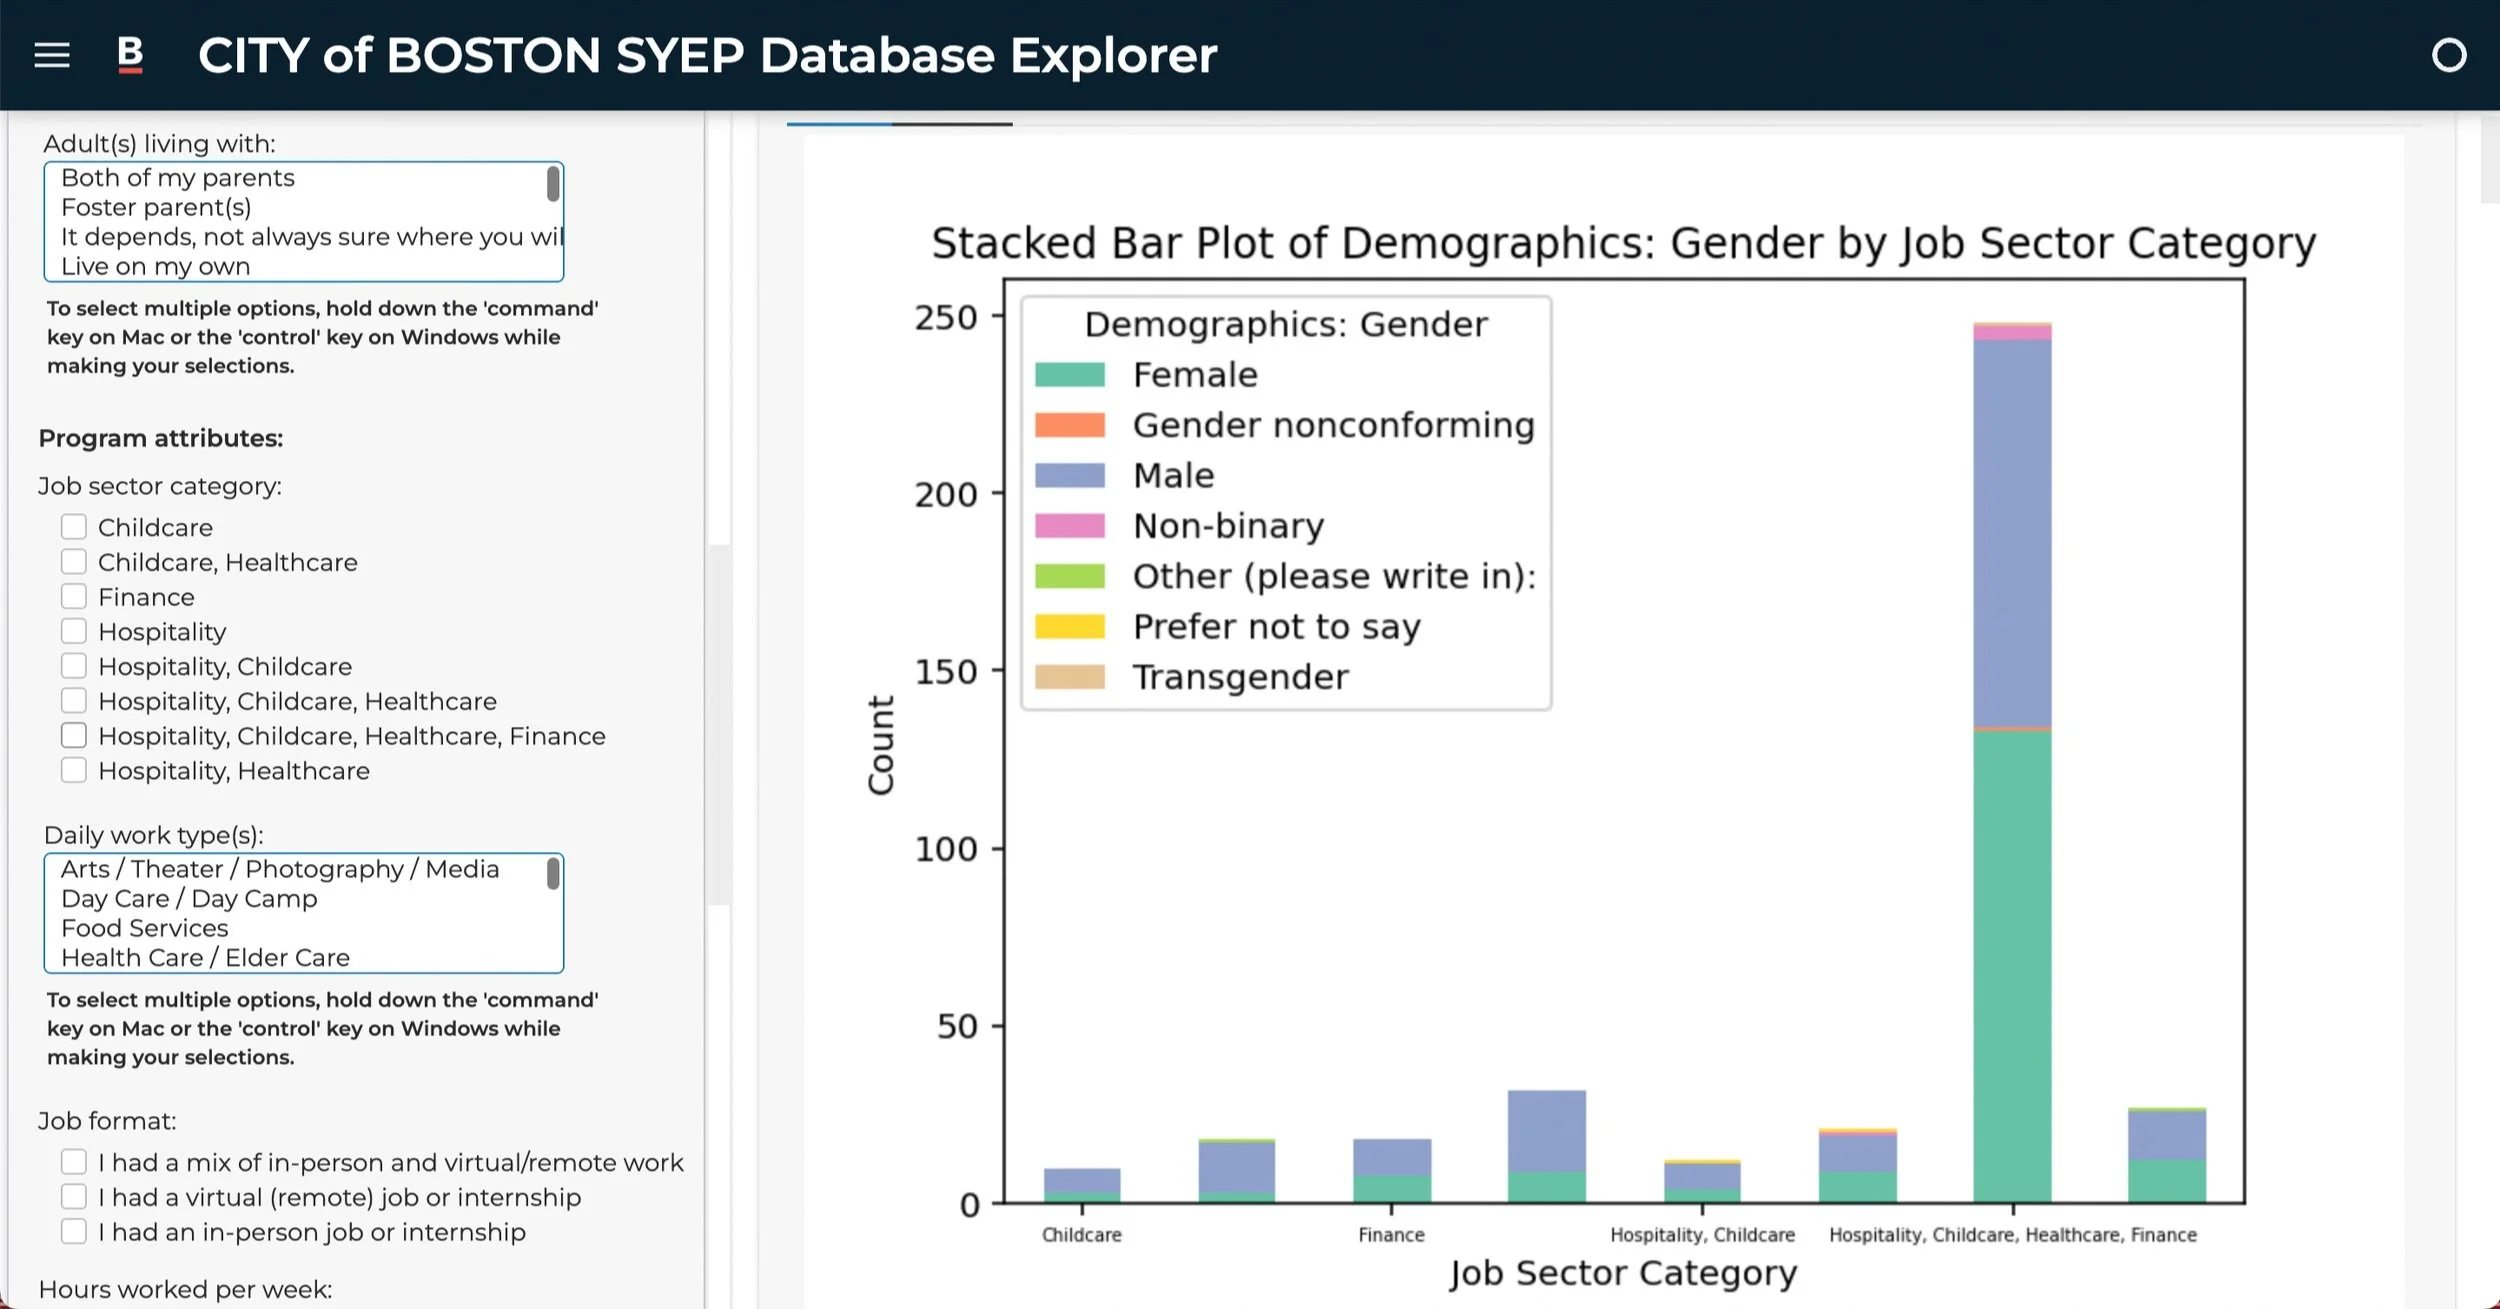


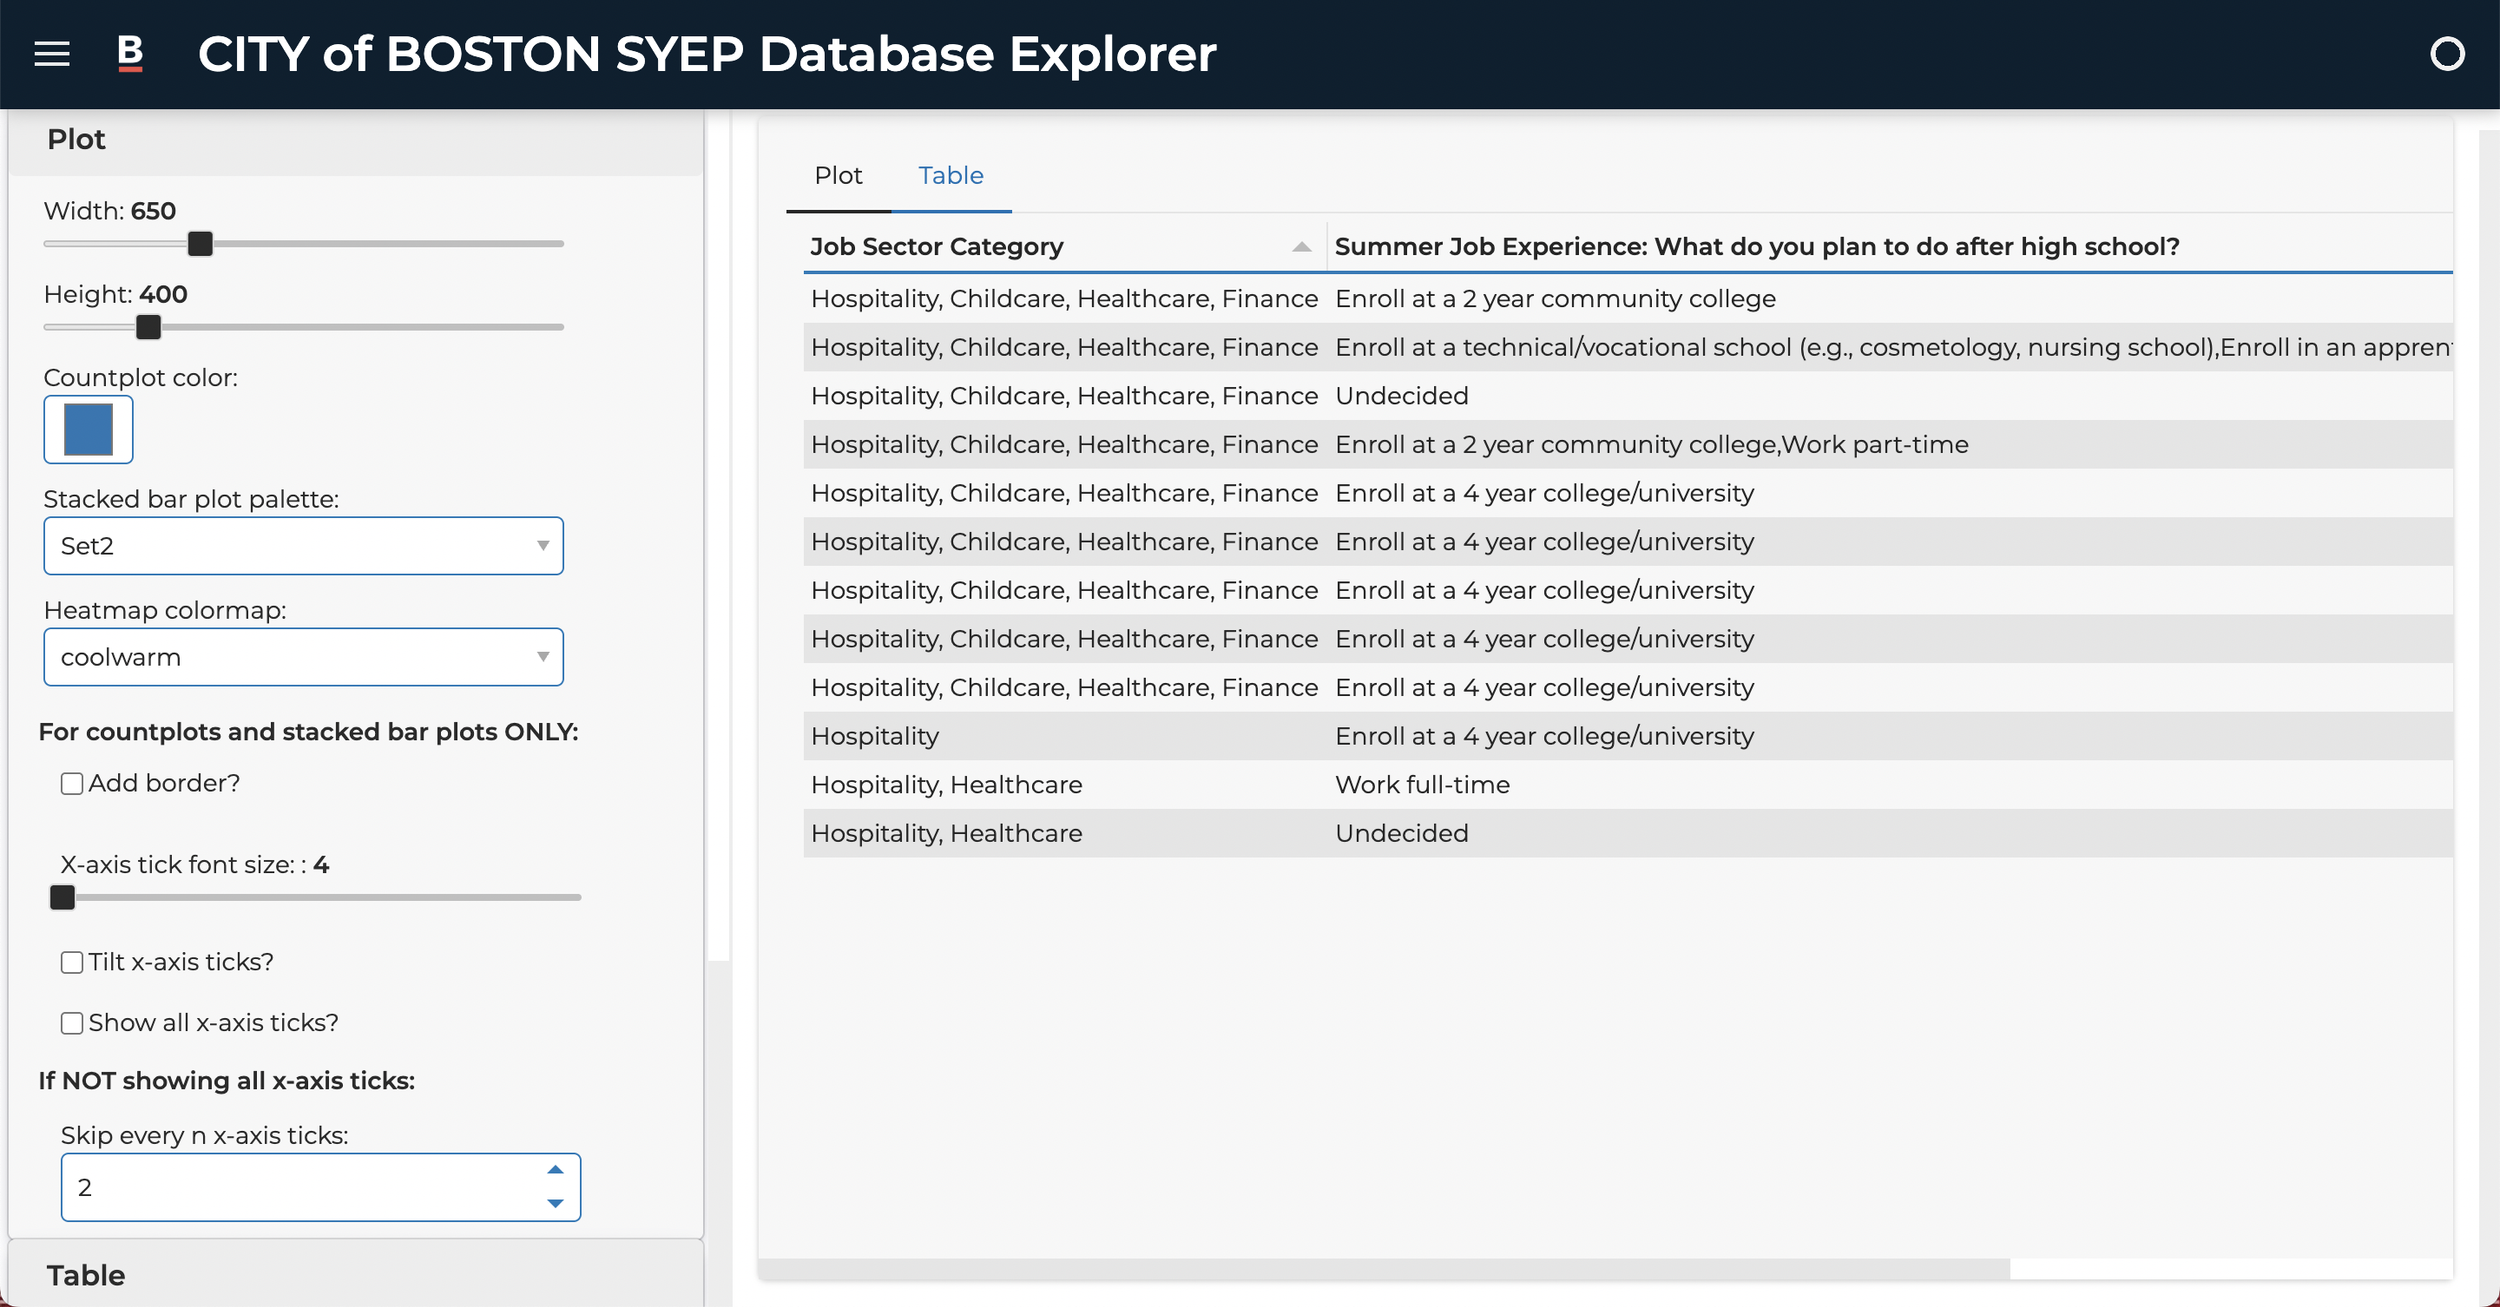
Sample dashboard outputs
* Dashboard is generated locally when syep_explorer.py is executed and is publicly hosted at https://syep.onrender.com/syep_explorer
As part of my PEAK award for this project, I had the opportunity to present my research at RISE, Northeastern’s internal research expo in April 2025. The poster that I created for and presented at the event can be found below.


As my lengthiest data science project to date, this project taught me many valuable lessons in programming, research, and public policy. As a programmer, I learned how to modify pre-built Python packages to fit my own needs, researching documentation and implementing updates through trial and error. This dashboard was heavily based off of a similar Holoviz dashboard I created in my DS3500 Advanced Programming with Data class, but I enjoyed applying my design background through CSS to create a final product that aligned with the City of Boston’s formal brand.
In terms of research, this project under Dr. Modestino was only my second formal research project to date, the other being with Dr. Modestino over the summer of 2024. Through this experience, I learned how to better collaborate with the research team, set my own scope/goals, success criteria, and timeline for the project, as well as write about/present my work formally to others. These skills are invaluable in both the data sciences and social sciences, and I am grateful to have been a part of the PEAK cohort through this project this year to better my research skills moving forward.
Finally, because this project on evaluating the impact of the Summer Youth Employment Program is a continual partnership with the City of Boston, I got to learn a bit about the policies in place to support these educational programs and the ways in which program improvements are implemented. During weekly team meetings, I got to hear directly from City of Boston employees and even created the publicly-hosted dashboard website for eventual integration into the City of Boston’s domain. As a result of this collaboration, I got to see firsthand how data analysis can be used to make tangible policy recommendations and program improvements to expand youth employment access in marginalized communities. This ignited a deep passion and commitment to continue to use programming to drive positive social change moving forward.